Chapter 1
The rig at a glance
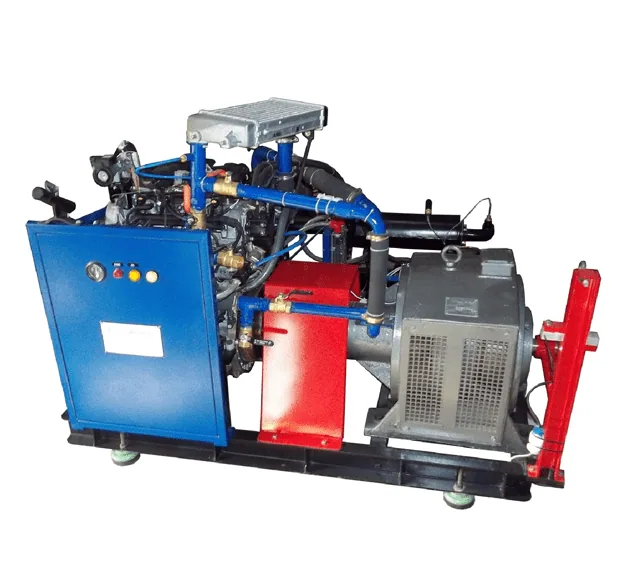
A computerized engine test rig puts an engine under a controlled load and measures everything that goes in and comes out: air, fuel, power, heat and cylinder pressure. Tap a numbered part to see what it does.
- 1 Engine
- The engine under test — a single- or multi-cylinder diesel or petrol engine, water cooled. On VCR rigs the cylinder head can be raised or lowered to change the compression ratio.
- 2 Eddy-current dynamometer
- Absorbs the engine's power. Increasing the excitation current increases the braking torque, so you set the engine load from the panel.
- 3 Tyre coupling
- A flexible coupling between engine and dynamometer that absorbs vibration and small misalignment.
- 4 Load cell
- A strain-gauge load cell on the dynamometer's torque arm. The force it measures, times the arm length, is the engine torque.
- 5 Crank angle encoder
- 360 pulses per revolution plus a TDC pulse: gives engine speed and the exact crank angle for every pressure reading (1° resolution).
- 6 Combustion pressure sensor
- A piezo-electric sensor (0–100 bar) in the cylinder head that records cylinder pressure throughout the cycle.
- 7 Air tank with orifice and DP sensor
- Air enters the tank through a calibrated orifice. The pressure drop across it, measured by a differential-pressure (DP) sensor, gives the air flow. The tank smooths out the engine's pulsating intake.
- 8 Fuel measurement
- Fuel flows through a measuring tube with an optical liquid-level sensor. The software times how long the engine takes to use a fixed volume.
- 9 Exhaust gas calorimeter
- A shell-and-tube heat exchanger: cooling water picks up heat from the exhaust gas so the energy leaving with the exhaust can be measured.
- 10 Rotameters
- Show the water flow to the engine jacket and to the calorimeter.
- 11 Temperature sensors
- K-type thermocouples measure water inlet/outlet and exhaust temperatures for the heat balance.
- 12 Panel, DAQ and software
- Signal transmitters and a 200 kS/s data acquisition card feed a PC running Engine Test Express, which calculates performance and combustion results live.
Chapter 2
How each quantity is measured
Every result on the screen starts as a sensor signal. Choose a quantity to follow its path through the rig.
Air flow
Orifice → pressure drop h (mm of water) → DP sensor → transmitter → DAQ. The software converts h into air volume flow with the orifice equation, then compares it with the engine's swept volume to give volumetric efficiency.
Fuel consumption
Optical level sensor → timer → DAQ. Fixed volume (for example 10 cc) ÷ time taken × fuel density = mass of fuel per second.
Load, speed and cylinder pressure
Load cell → torque. Crank angle encoder → speed and crank position. Piezo pressure sensor → charge amplifier → DAQ, sampled every degree of crank angle.
Exhaust
Exhaust gas passes through the calorimeter; thermocouples measure gas and water temperatures so the heat carried away by the exhaust can be calculated.
Cooling water
Rotameters set the flow; thermocouples measure inlet and outlet temperature at the engine jacket and the calorimeter. Flow × specific heat × temperature rise = heat carried away.
Chapter 3
Running a test
A typical load test, from start-up to shutdown. Always follow your laboratory's safety rules and the rig's instruction manual.
Check before starting
Fuel level, lubricating oil level, cooling water supply, all connections tight, dynamometer at zero load.
Set the water flows
Open the cooling water and set the engine jacket and calorimeter flows on the rotameters. Note the values — you need them for the heat balance.
Start the PC and software
Switch on the panel and PC, open Engine Test Express and enter the engine details (bore, stroke, compression ratio, arm length, fuel properties).
Start and warm up
Start the engine at no load and let it run until the cooling water outlet temperature is steady.
Apply load in steps
Increase the load in steps (for example 0, 25, 50, 75 and 100 % of rated load), keeping the speed in range.
Record at steady state
At each step, wait until readings settle, then log the performance readings and a set of combustion cycles.
Unload and shut down
Reduce the load to zero, let the engine idle to cool, then stop it. Keep the cooling water running for a few minutes.
Analyse
Export the results and plot BP against BSFC, brake thermal efficiency and volumetric efficiency; compare P-θ diagrams at different loads.
Chapter 4
What the numbers mean
The software does these calculations for you, but knowing them lets you check results and understand what they tell you. The worked example uses typical values for a 3.7 kW single-cylinder diesel (bore 80 mm, stroke 110 mm, dynamometer arm 0.185 m) — take the exact values for your rig from its manual.
Try your own readings
Brake power
T = W × g × R = 21.78 N·m
BP = 2π N T / 60 000
3.42 kW
Fuel consumption and BSFC
ṁf = volume × density / time = 0.905 kg/h
BSFC = ṁf / BP
0.265 kg/kWh
Brake thermal efficiency
Fuel power = ṁf × CV = 10.56 kW
ηbth = BP / fuel power
32.4 %
Volumetric efficiency
Air in = Cd A √(2 g Hair) = 21.5 m³/h
Swept volume 553 cc, taken in every 2nd revolution
86.5 %
Mechanical efficiency
IP = BP + FP = 4.52 kW
ηmech = BP / IP
75.7 %
Heat balance
Where the fuel's energy (10.56 kW) goes:
- Brake power 32.4 %
- Cooling water 26.4 %
- Exhaust 36.2 %
- Unaccounted (radiation, friction heat…) 5.0 %
Chapter 5
Combustion analysis
The pressure sensor and crank angle encoder together record cylinder pressure at every degree. Plotted against crank angle (P-θ) or cylinder volume (P-V), they show what happens inside the cylinder. Move the slider to turn the crankshaft.
Compression stroke: both valves closed, the piston squeezes the air.
- Peak pressure
- 52 bar at 13° after TDC
- Gross IMEP
- 6.4 bar — the steady pressure that would do the same work on the piston
- Indicated power
- IMEP × swept volume × power strokes per second = 4.45 kW (compare chapter 4: 4.52 kW)
The dashed curve is the motored pressure — the engine turned without fuel. The gap between the curves is the pressure added by combustion. From the same data the software calculates the heat release rate, mass fraction burnt, start of combustion and combustion duration.
Chapter 6
Variants: VCR and Open ECU
Variable compression ratio (VCR)
On VCR rigs (CVCR series) the cylinder head assembly can be raised or lowered while the engine is stopped, changing the clearance volume and so the compression ratio — typically from 5:1 to 20:1. Higher compression raises compression temperature and pressure, improving efficiency, until knock (petrol) or mechanical limits set the ceiling.
Open ECU
On -OECU rigs an Open ECU replaces fixed production maps: you set injection timing, rail pressure, spark timing and EGR yourself, and see their effect immediately. Injecting earlier starts combustion earlier, raising peak pressure — up to the point where the pressure rise works against the rising piston.
- Peak pressure
- 52 bar at 13° after TDC
- Gross IMEP
- 6.4 bar
Simplified single-zone model for learning — real engines also lose heat to the walls and vary cycle to cycle.
Chapter 7
Test your knowledge
-
What does the eddy-current dynamometer do on the rig?
Absorbs the engine's power and applies the load. Raising its excitation current raises the braking torque, which is how the engine load is set.
-
Engine torque is calculated from…
Load cell force × torque arm length. T = W × g × R: the load cell measures the force on the dynamometer's torque arm of length R.
-
How is the air flow into the engine measured?
Pressure drop across an orifice into an air tank. A DP sensor measures the pressure drop across a calibrated orifice; the orifice equation turns it into volume flow.
-
Why is the orifice fitted to an air tank rather than directly to the intake?
To smooth the engine's pulsating intake so the reading is steady. A single-cylinder engine draws air in pulses; the tank damps them so the orifice sees a steady flow.
-
Brake specific fuel consumption (BSFC) tells you…
Fuel used per kWh of brake power — lower is better. BSFC = fuel mass flow ÷ brake power, in kg/kWh. A lower value means the engine converts fuel to work more efficiently.
-
Brake thermal efficiency is…
BP ÷ (fuel mass flow × calorific value). It compares useful shaft power with the chemical energy supplied in the fuel.
-
Volumetric efficiency compares…
The actual air drawn in with the swept volume. It shows how well the engine breathes: the air actually inducted versus what the swept volume could hold.
-
Willan's line is used on a diesel engine to find…
Frictional power. Plot fuel flow against BP and extend the line to zero fuel: the BP intercept gives the frictional power.
-
In a four-stroke engine, each cylinder draws in a fresh charge…
Every second revolution. Intake, compression, power and exhaust take two crank revolutions — so swept volume is taken in at N/2 per minute.
-
On the P-θ diagram, the gap between the fired and motored curves shows…
The pressure added by combustion. The motored curve is the engine turned without fuel; anything above it comes from combustion.
Answers
- Absorbs the engine's power and applies the load
- Load cell force × torque arm length
- Pressure drop across an orifice into an air tank
- To smooth the engine's pulsating intake so the reading is steady
- Fuel used per kWh of brake power — lower is better
- BP ÷ (fuel mass flow × calorific value)
- The actual air drawn in with the swept volume
- Frictional power
- Every second revolution
- The pressure added by combustion
See the rigs
-
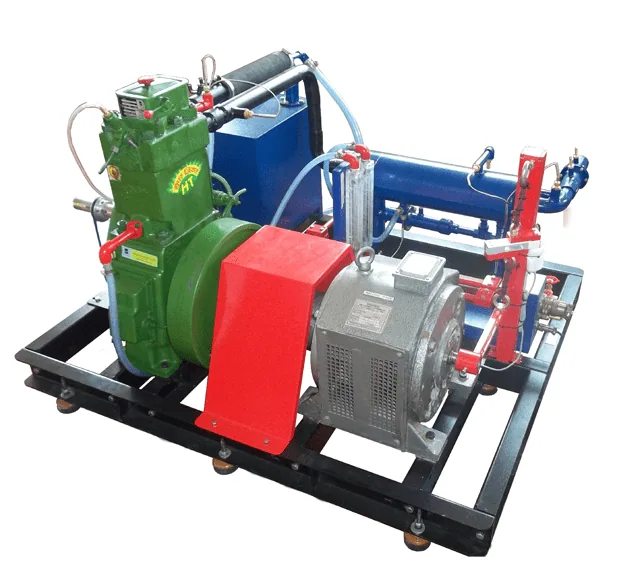
ICC01 Computerized Single Cylinder Four Stroke Diesel Engine Test Rig
-
ICC01-OECU Computerized Single Cylinder Four Stroke Diesel Engine Test Rig with CRDI Open ECU and EGR
-
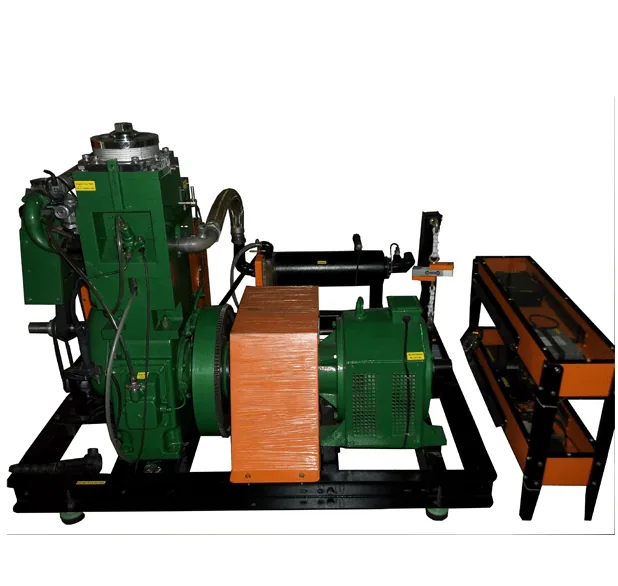
CVCR02 Computerized Variable Compression Ratio Diesel Engine Test Rig
-
ICC03 Computerized Four Stroke Four Cylinder Water Cooled Diesel Engine Test Rig